The information below has not been updated to reflect the methodology
updates implemented for the final release of Benchmark Reports in October. As
such, some details, metrics, or examples may no longer align with the revised
approach. For the most accurate and up-to-date information, please refer to the
Supplemental Scoring Guidance
which provides a detailed explanation of the updated methodology, a comparison
with the previous approach, and practical examples to illustrate the
changes.
This indicator is answered and scored at the asset level. Scores are calculated for each property sub-type & country
combination through aggregation, using floor area as a weighting factor. Subsequently, scores are calculated at the
portfolio level (across all applicable property sub-types & countries) through further aggregation, using percentage
of GAV (in R1) reported per property sub-type & country.
The score of this indicator equals the sum of the scores achieved by:
- Data coverage = 8.5 points;
- Like-for-Like data availability = 0.5 points;
- Like-for-Like performance improvement = 2 points;
- Renewable energy = 3 points. The renewable energy score is split as follows:
- On-site renewable energy = 1 point;
- Off-site renewable energy = 0.5 points;
- Performance = 2 points.
Data coverage:
Data coverage percentages, based on both area and time for which data is available, are scored separately against
different benchmarks for landlord and tenant controlled areas for each asset, where "landlord
controlled" and "tenant controlled" areas can include:
- Landlord controlled areas: Landlord Controlled Whole Building, Base Building, and Landlord
Controlled Tenant Spaces
- Tenant controlled areas: Tenant Controlled Whole Building, and Tenant Controlled Tenant Spaces
Benchmarks are constructed based on the Property Sub-Type and Country of the asset. First, an attempt is made to
construct a benchmark by grouping together values from assets with the same Property Sub-Type and located in the
same Country. If there are not at least 20 values from 5 distinct reporting entities, the Property Sub-Type
classification and then the Country specificity is gradually decreased. For example, the Property Sub-Type becomes
Property Type and then Property Sector. Then the specificity of the Country is decreased to Sub-Region, Region,
Super-Region and Global.
Note: For the property types please see Appendix
3a of the Reference Guide.
A score is then calculated based on how the value reported for this asset compares to the assets of the benchmark.
The resulting scores at the asset level are then aggregated to a single score using a weighted mean with weights
determined by floor
area, except for base building and tenant space for which base building has a static weight of 40% and tenant
space has a static weight of 60%. As tenant space can be both landlord and tenant controlled, the 60% weight has
to be shared between the two which is done based on relative floor area.
Like-for-Like performance improvement:
Like-for-Like performance is scored based on the percentage change in consumption of the asset using a methodology
identical to
the scoring of data coverage, except for that having a lower value (for example a negative one) always results in a
higher or equal score, and that scores are aggregated using Like-for-Like consumption in the previous year as
weights instead of area.
Note: data reported for the outdoor area is included in the Like-for-Like scoring and outlier check
but excluded from the data coverage scoring.
Like-for-Like data availability:
Points for Like-for-Like data availability are given if any Like-for-Like data is provided and not
excluded in the GRESB outlier check.
Renewable energy:
The scoring of this section is split into two parts. The first part can result in a maximum of 1/3 of the
maximum score. This is achieved if any on-site renewable energy was generated in the current year. If
this is not the case, but some off-site renewable energy was generated in the current year, then 1/6 of
the maximum score is achieved instead.
The remaining 2/3 of the maximum score is given based on the percentage of renewable energy in the
current year and the improvement compared to the previous year. These two elements are combined using the
following formula, where p is the percentage of renewable energy and i is the improvement
score:
Score = (100 + p) / 200 * p / 100 + (100 - p) / 200 * i
The improvement score is calculated based on the improvement in the percentage of renewable energy compared to
the previous year. The improvement is scored by comparing it against a benchmark based on the improvements of
other assets. Note that only improvements are included in this benchmarking model, so values <= 0 are ignored.
Besides this, the benchmark scoring methodology is identical to the one used for coverage, see details
above.
Outlier checks:
GRESB identifies outliers in performance data reported at the asset level. There are two kinds of outliers flagged by the GRESB Portal: Intensities and Like-for-Like (LFL) change in consumption/emission. Outliers are validated automatically based on fixed thresholds. There are two levels of automatic outlier validation:
- If an outlier is detected above the upper threshold or below the lower threshold, then the data points associated with that outlier will be included in aggregation and scoring. However, they will not be included in the creation of the scoring benchmarks.
- If the outlier is substantially higher than the upper threshold (more than 1000 times greater), the data points associated with that outlier will not be included in aggregation or scoring.
Intensity outliers: The threshold for detecting an intensity outlier varies by data type and property type. Intensity outlier values are normalized by vacancy and by data availability.
Like-for-like outliers: The threshold for detecting a LFL outlier varies between 20 - 30%, based on the previous year’s consumption value. LFL outlier values are normalized by vacancy.
Open text box:
The content of the open text box at the end of the indicator is not used for scoring, but will be included in the Benchmark Report.
Energy Efficiency Scoring Example
Step 1: Calculate the energy intensity for each asset
The Energy Efficiency score is calculated for assets that:
- Are classified as Standing Investments for the full reporting year
- Are owned for the full reporting year
- Have a vacancy rate lower than 20%
- Have an Energy Data Coverage (Area/Time) of 75% or above
The assets’ energy intensity is calculated as
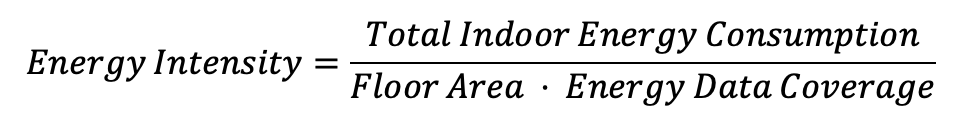
Table 1 - Step 1 Calculations
|
Country |
Property Sub-Type |
Floor Area (m2) |
Energy Consumption (kWh) |
Data Coverage |
Energy Intensity (kWh/m2) |
| Asset 1 |
US |
Office: Corporate: High-Rise |
1000 |
120,100 |
100% |
120.1 |
| Asset 2 |
US |
Office: Corporate: High-Rise |
500 |
76,000 |
80% |
190.0 |
| Asset 3 |
US |
Office: Corporate: High-Rise |
800 |
94,000 |
60% |
Asset does not qualify for Energy Efficiency score |
Step 2: Calculate the Energy Efficiency score at the asset level
The Energy Efficiency score is calculated based on the relative percentile position of the Energy Intensity metric
against the relevant GRESB benchmark distribution.
In addition:
- Portfolios with an Energy Intensity above the 90th percentile of the corresponding Energy Intensity benchmark
distribution receive 0 points.
- Portfolios with an Energy Intensity below the 10th percentile of the corresponding Energy Intensity benchmark
distribution receive a full score of 10 points.
The Energy Efficiency benchmarks consist of assets that:
- Are Standing Investments for the full reporting year
- Are Owned for the full reporting year
- Have a vacancy rate lower than 20%
- Have an Energy Data Coverage (Area/Time) coverage 100%
Benchmarks are constructed based on the Property Sub-Type and Country of the asset. First, an attempt is made to
construct a benchmark by grouping together values from assets with the same Property Sub-Type and located in the
same Country. If there are not at least 20 values from 5 distinct reporting entities, the Property Sub-Type
classification and then the Country specificity is gradually decreased. For example, the Property Sub-Type
becomes Property Type and then Property Sector. Then the specificity of the Country is decreased to Sub-Region,
Region, Super-Region and Global.
Table 2 - Step 2 Calculations
|
Country |
Property Sub-Type |
Energy Intensity |
90th Percentile Benchmark Cutoff |
10th Percentile Benchmark Cutoff/center> |
Percentile of observation |
Asset Energy Intensity Score |
| Asset 1 |
US |
Office: Corporate: High-Rise |
120.1 |
186.8 |
10.2 |
38 |
3.8 |
| Asset 2 |
US |
Office: Corporate: High-Rise |
190.0 |
186.8 |
10.2 |
6 |
0 |
| Asset 3 |
Netherlands |
Office: Corporate: High-Rise |
108.6 |
164.7 |
8.6 |
44 |
4.4 |
Step 3: Calculate the Energy Efficiency score at the Property Sub-Type and Country level
Asset-level Energy Efficiency scores are aggregated at the Property Sub-Type and Country level (e.g. Office:
Corporate: High-Rise in US) using floor area weights as a factor.
Table 3 - Step 3 Calculations
|
Country |
Property Sub-Type |
Floor Area |
Asset Energy Intensity Score |
| Asset 1 |
US |
Office: Corporate: High-Rise |
1,000 |
3.8 |
| Asset 2 |
US |
Office: Corporate: High-Rise |
500 |
0 |
| Asset 3 |
Netherlands |
Office: Corporate: High-Rise |
1,000 |
4.4 |
Energy Efficiency Score Office: Corporate: High-Rise, US = (3.8*1,000 + 0*500)/1,500 = 2.53
Step 4: Calculate the Energy Efficiency score at the Portfolio level
Property Sub-Type and country Energy Efficiency scores are aggregated to Portfolio level (using the Percentage of GAV as a weighting factor).
Table 4 - Step 4 Calculations
Property Sub-Type/ Country |
Energy Efficiency Score |
% GAV |
| Office: Corporate: High-Rise, US |
2.53 |
70% |
| Office: Corporate: High-Rise, Netherlands |
4.40 |
30% |
Energy Efficiency score Portfolio = 2.53*70% + 4.4*30% = 3.1

 Management: Leadership
 Management: Policies
 Management: Reporting
 Management: Risk Management
 Management: Stakeholder Engagement
![[OprPortfolioCompTable]](/images/tables/opr_portfolio_comp_table/y2024-8d409116.svg)
 Performance: Risk Assessment
![[TechnicalAssessments]](/images/tables/technical_assessments/y2020-5edb66a5.svg)
![[EnergyMeasures]](/images/tables/energy_measures/y2020-586f48b2.svg)
![[WaterMeasures]](/images/tables/water_measures/y2020-be8f36db.svg)
![[WasteMeasures]](/images/tables/waste_measures/y2020-86b6dd69.svg)
 Performance: Targets
![[TargetsTable]](/images/tables/targets_table/y2020-8c992e9c.svg)
![[NZTargetsTable]](/images/tables/nztargets_table/y2023-ff526251.svg)
 Performance: Tenants & Community
 Performance: Energy
![[PreTable]](/images/tables/pre_table/y2020-1c2702d9.svg)
![[EnergyConsumption]](/images/tables/energy_consumption/y2024-877b70a7.svg)
![[EnergyCoverage]](/images/tables/energy_coverage/y2024-7c8d2d6b.svg)
![[EnergyRenewable]](/images/tables/energy_renewable/y2024-87697ab6.svg)
 Performance: GHG
![[GHGTables]](/images/tables/ghgtables/y2024-ed6b6eab.svg)
![[GHGCoverage]](/images/tables/ghgcoverage/y2024-a14c1a51.svg)
 Performance: Water
![[WaterTables]](/images/tables/water_tables/y2024-8c21538e.svg)
![[WaterCoverage]](/images/tables/water_coverage/y2024-bc9b4196.svg)
![[WaterRecycling]](/images/tables/water_recycling/y2024-ed4cae9e.svg)
 Performance: Waste
![[WasteTable]](/images/tables/waste_table/y2024-16b3abc6.svg)
![[WasteDisposal]](/images/tables/waste_disposal/y2024-6eeb9150.svg)
 Performance: Data Monitoring & Review
 Performance: Building Certifications
![[CertificationTable]](/images/tables/certification_table/y2024-4b7e99e4.svg)
![[EnergyRatingTable]](/images/tables/energy_rating_table/y2024-1dbc7089.svg)
![[DevPortfolioCompTable]](/images/tables/dev_portfolio_comp_table/y2024-49c37a96.svg)
 Development: ESG Requirements
 Development: Building Certifications
![[DevCertificationsRegisteredTable]](/images/tables/dev_certifications_registered_table/y2024-8d8f3ec4.svg)
![[DevCertificationsObtainedTable]](/images/tables/dev_certifications_obtained_table/y2024-d1714da8.svg)
 Development: Materials
 Development: Energy
 Development: Water
 Development: Waste
 Development: Stakeholder Engagement