This document outlines the scoring methodology of the 2024 Infrastructure Asset Assessment. It is shared for information purposes, to provide transparency on the Assessment, Methodology and Scoring processes.
This document provides a breakdown of how each indicator is scored in the 2024 GRESB Infrastructure Asset Assessment. We recommend reading it in conjunction with the Reference Guide, which includes the reporting requirements and validation details for indicators.
- The overall scoring weight for each indicator is shown by the number of points at the bottom of each indicator.
- The breakdown of the scoring within each indicator is shown by the numbers and brackets in red (and blue) on the left side of each scored indicator.
- Values on the far left represent the fraction of the total indicator score apportioned to the respective indicator element. These values sum to one for each indicator.
- The square brackets "[" show a grouping of sub-elements within an indicator. The values within the square brackets represent the fraction of the element that is allocated to each sub-element.
- The Symbol "x" (outside or inside brackets) indicates use of a multiplier. A multiplier can take a value between zero and one and is multiplied by other fractional scores within the indicator or by the overall indicator. The details of the multiplier function are provided in the text at the bottom of each indicator.
- Blue brackets represent a ‘Diminishing Increase in Scoring’ approach being applied. This scoring methodology is described further below.
- The text below the indicator explains further how the scoring works.
Please note the following:
- The overall scoring weight for each indicator is shown by the number of points at the bottom of each indicator.
- The breakdown of the scoring within each indicator is shown by the numbers and brackets in red (and blue) on the left side of each scored indicator.
- Values on the far left represent the fraction of the total indicator score apportioned to the respective indicator element. These values sum to one for each indicator.
- The square brackets "[" show a grouping of sub-elements within an indicator. The values within the square brackets represent the fraction of the element that is allocated to each sub-element.
- The Symbol "x" (outside or inside brackets) indicates use of a multiplier. A multiplier can take a value between zero and one and is multiplied by other fractional scores within the indicator or by the overall indicator. The details of the multiplier function are provided in the text at the bottom of each indicator.
- Blue brackets represent a ‘Diminishing Increase in Scoring’ approach being applied. This scoring methodology is described further below.
- The text below the indicator explains further how the scoring works.
Scoring Methodology
Asset Scoring
The sum of the scores for all indicators adds up to a maximum of 100 points, therefore the overall GRESB Score - Infrastructure Asset is an absolute measure of ESG management and performance expressed as a percentage.
The GRESB Infrastructure Asset Assessment is split into two components namely, the Management Component and Performance Component. The overall GRESB Score - Infrastructure Asset is the sum of the Management Score - Infrastructure Asset and the Performance Score - Infrastructure Asset:
GRESB Score = Management Score + Performance Score

GRESB Rating
The GRESB Rating is an overall relative measure of ESG management and performance of the asset.
The calculation of the GRESB Rating is based on the GRESB Score and its quintile position relative to the GRESB universe, with annual calibration of the model. If the participant is placed in the top quintile, it will have a GRESB 5‑star rating; if it ranks in the bottom quintile, it will have a GRESB 1‑star rating, etc.
Materiality-based Scoring
GRESB uses Materiality‑based scoring across the Asset Assessment. This process applies the well proven process of materiality assessment to scoring ensuring that all assets are assessed and scored based on the ESG issues that are most material to their circumstances.
The materiality-based scoring process is illustrated in the diagram below.

Materiality Factors
The first part of the process is contained within the GRESB Materiality Assessment indicator (RC7). In this indicator, a set of 15 simple questions relating to Materiality factors are answered using simple drop down selections. For six of the factors, answers are drawn from other indicators RC2, RC3 and RC5. These factors include for example the primary sector of the asset, its primary location, whether it is on contaminated land, and the number of customers it serves. See the GRESB Materiality Assessment indicator (RC7) for details of the materiality factors and their associated questions and answers.
ESG Issues
There are 46 ESG issues in the Asset Assessment (14 Environmental, 16 Social and 16 Governance). Each of the materiality factors is associated with one or more ESG issues, so that as the factor questions are answered, the materiality of the ESG issues is determined. Note that the materiality is fixed for seven of the 46 ESG issues (i.e. they are unaffected by the Materiality factors). There are four possible materiality levels that can be assigned to ESG issues, and these directly translate to a scoring weighting in the Assessment, as follows:
| Materiality | Weighting |
| No relevance | 0 |
| Low relevance | 0 |
| Medium relevance | 1 |
| High relevance | 2 |
Thus issues of No or Low relevance are deemed non-material and receive no score in the Assessment - effectively they are removed from consideration. Issues of Medium relevance receive Medium score weighting and issues of High relevance receive a high score weighting. For example, the ESG issue “Air pollution” is of “No relevance” for entities in the primary sector ‘Renewable power: Solar power generation’,, therefore it does not need to be considered by entities in this sector in the Assessment. On the other hand, for entities in the primary sector ‘Power generation x-Renewables: Independent Power Producers: Gas-Fired Power Generation’, Air pollution is deemed of High relevance and therefore requires close consideration throughout the Assessment. The outcome of completing the GRESB Materiality Assessment indicator is an entity-specific materiality weighting for each of the ESG issues. These weightings are displayed at the bottom of the indicator in the portal.
Once each of the ESG issues has been assigned a materiality weighting (relevance), these apply to certain indicators in both the Management and Performance Components in slightly different ways.
Management Component
For the Management Component, the indicators in the aspect ‘Policies’ and six indicators in the aspect ‘Risk management’ are subject to materiality-based scoring. These indicators cover the standard list of (46) Environmental, Social and Governance issues and are scored based on how many of the material issues are addressed. Consider for example, the indicator ‘Policies on environmental issues’ (PO1). Each of the 13 standard Environmental issues will receive a materiality weighting from the GRESB Materiality Assessment.
Performance Component
For the Performance Component, most indicators are subject to materiality-based scoring (only Implementation, Output & Impact and Certification & Awards aspects are not). Each indicator addresses a specific ESG issue, so the materiality weightings from the GRESB Materiality Assessment apply directly to the weighting of each whole indicator.
Indicators relating to ESG issues of High relevance are weighted highly, and Medium relevance moderately. Indicators relating to issues of No or Low relevance are not scored. The weighting of the material (scored) indicators is automatically redistributed to ensure that the Performance Component retains its overall weighting of 60% of the Asset Assessment. In the earlier example of an Asset with a primary sector ‘Renewable power: Solar power generation’, the indicator ‘Air pollution’ will not be scored and more weight will be given to other, material indicators (like Energy).
This means that materiality-based scoring brings the focus only on material ESG issues, minimizing the reporting burden for participants.
The Materiality Tool
Whilst the GRESB Materiality Assessment and the whole materiality-based scoring process are straightforward to understand and apply, some participants may want to understand them, and how they apply to their situation, in more detail. GRESB provides an Excel based GRESB Materiality & Scoring Tool for this purpose. This tool duplicates the materiality-based scoring process embedded in the portal but in an easier and more transparent layout. In addition, the tool provides the ability for participants to rtecord their own view of materiality for each issue and provide associated justification for feedback to GRESB in future refinement of materiality-based scoring. Completed feedback should be sent to the GRESB via the contact form . The tool also contains a ‘Materiality Matrix’ and a ‘Sector Determined’ matrix that transparently link each Materiality factor answer to the relevance for the associated ESG issues. Finally, the tool contains a Scoring and Weighting sheet that shows how indicator weightings are modified by the materiality-based scoring.
Scoring Weightings
The Management component is made up of 5 Aspects, whilst the Performance component consists of 12. The Asset Assessment contains 50 indicators with the exclusion of Entity & Reporting Characteristics. The below weights apply for 2024.

For informational purposes, the Maximum Scores for the materiality-driven performance indicators have been set as equally weighted*
Indicator Scoring
The following is a scoring overview of indicators in the 2024 Infrastructure Asset Assessment. Some general remarks and notes on the structure of indicators:
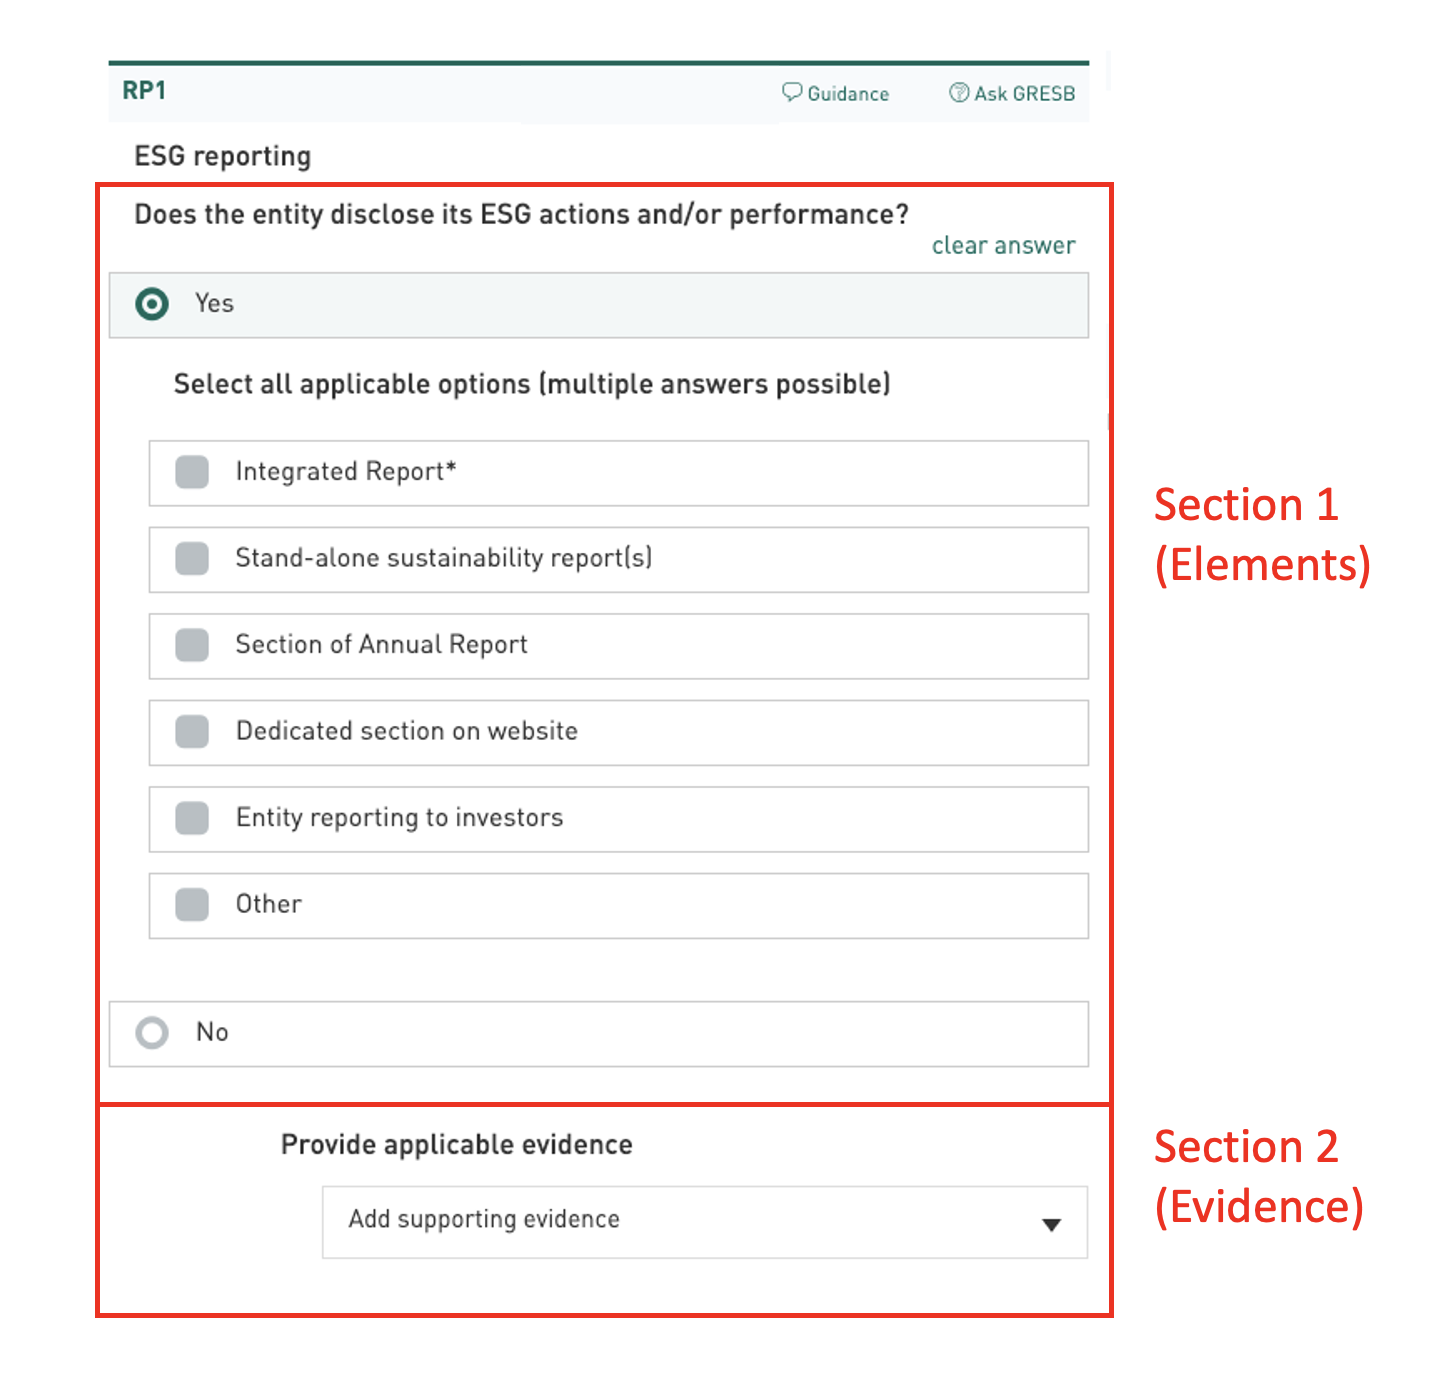
There are four scoring models used within indicators:
- One Section indicator - consisting of only Section 1 (Elements)
- Two Section indicator (Evidence validated) - consisting of both Section 1 (Elements) & 2 (Evidence).
- Two Section indicator (Evidence not validated) - consisting of both Section 1 (Elements) & 2 (Evidence) where the evidence provided is not validated and is for reporting purposes only.
- Not scored
The overall outcome of these models is to generate a fractional score (i.e. between zero and one) which is then multiplied by the indicator weighting (maximum score) to generate the score for the indicator.
Section One (Elements)
Every scored indicator begins with this section which can receive a fractional score (i.e. between zero and one), determined by selections made in checkboxes and radio buttons, and answers provided in open text boxes. Based upon these inputs, fractional scores are calculated using either an aggregated fractions or a diminishing increase in scoring methodology.
Aggregated scoring: For indicators where one or more answers can be selected, fractional scores are awarded cumulatively for each individual selected answer and then aggregated to calculate a final fractional score for the section. In some cases, each checkbox answer may be equally weighted and in others, each checkbox answer may be assigned a higher or lower fractional score each, to reflect best practice responses. For many indicators, the final fractional score is capped at a maximum, which means that it is not necessary to select all checkbox answers in order to receive full points.
Materiality-based scoring: These indicators are similar to Aggregated points, where points are awarded cumulatively for each individual selected answer and then aggregated to calculate a final score for the indicator. Where materiality-based scoring applies, each checkbox answer is weighted to reflect the materiality of the relevant ESG issue, as determined by the GRESB Materiality Assessment.
Diminishing increase in scoring: The idea behind this concept is that the fractional score achieved for each additional data point provided decreases as the number of provided data points increases. This means that the fractional score achieved for the first data point will be higher than the fractional score achieved for the second, which again will be higher than for the third, and so on.

If an indicator is a One Section indicator, the score calculated in this section will also be its final score.
Section 2 (Evidence)
Some indicators require evidence to verify information provided in section 1 (Elements). In these cases, the fractional score for the evidence section acts as a multiplier to the Section 1 fractional score. Mandatory evidence receives a multiplier of zero (0) for no evidence or not-accepted evidence, 0.5 for providing partially accepted evidence and 1 for providing fully accepted evidence. To clarify, the indicator will receive no points unless the hyperlink and/or uploaded document is considered valid (i.e. partially and/or fully accepted).
The final indicator score is then calculated as:
Indicator score = Indicator score = (Section 1 fractional score) X (Section 2 multiplier) X Indicator weighting
Example of indicator level scoring:
Example: LE6 indicator
Personnel ESG performance targets
Does the entity include ESG factors in the annual performance targets of personnel?
Does performance against these targets have predetermined financial consequences? (multiple answers possible)
Select the personnel to whom these factors apply (multiple answers possible):
1
3⁄4
C-suite level staff/Senior management
2⁄4
Dedicated staff on ESG issues
2⁄4
External managers or service providers
Provide applicable evidence
×
Upload or URL____________
Indicate where in the evidence the relevant information can be found____
Provide additional context for the answer provided (not validated, for reporting purposes only)
________________________
2.84 points
,
G
This indicator is split into two sections represented by a fraction and an "x" in the far-left column. The first section addresses the predetermined financial consequences of performance targets and the employee group(s) to which they apply, and the second section allows for scoring of evidence. The far-left column tells us that the score for the indicator is calculated as follows; (where the section and evidence scores are all fractions between 0 and 1):
Indicator score = (Employee groups with financial consequences fractional score X 1) X evidence score X 2.84 points
- Each checkbox selected is awarded the fraction score displayed next to it.
- The different fractions are summed up and then multiplied by the fractional score assigned to financial consequence.
- The aggregated fractional score can never be higher than 1.
- This aggregate value is then multiplied by the evidence score.
Evidence: The evidence is manually validated and assigned a multiplier, according to the table below. The evidence must support the validation requirements.
If any requirements are not met, the evidence may be partially accepted or not accepted depending on the level of alignment with the requirements.
| Validation status |
Score |
| Accepted |
2/2 |
| Partially accepted |
1/2 |
| Not accepted/not provided |
0 |
If the respondent achieved maximum fractional score for the first section, with fully accepted evidence (resulting in a multiplier of 1), the score would be:
1 X 1 X 2.84 points = 2.84 points


 Management: Leadership
 Management: Policies
 Management: Reporting
 Management: Risk Management
 Management: Stakeholder Engagement
 Performance: Implementation
![[ESGTable:Environmental]](/images/tables/esgtable_environmental/y2021-83eaf7c0.svg)
![[ESGTable:Social]](/images/tables/esgtable_social/y2021-c4ec636a.svg)
![[ESGTable:Governance]](/images/tables/esgtable_governance/y2021-37235073.svg)
 Performance: Output & Impact
![[PITable:OutAbs]](/images/tables/pitable_out_abs/y2024-1756cdaa.svg)
![[PITable:OutInt]](/images/tables/pitable_out_int/y2024-ab4261b7.svg)
 Performance: Energy
![[PITable:EnImp]](/images/tables/pitable_en_imp/y2024-3c21fe67.svg)
![[PITable:EnGenRen]](/images/tables/pitable_en_gen_ren/y2024-2bb9139b.svg)
![[PITable:EnExp]](/images/tables/pitable_en_exp/y2024-d799b459.svg)
![[PITable:EnCon]](/images/tables/pitable_en_con/y2024-13032a3a.svg)
![[PITable:EnInt]](/images/tables/pitable_en_int/y2024-440ba5c8.svg)
 Performance: Greenhouse Gas Emissions
![[PITable:GhgAbs]](/images/tables/pitable_ghg_abs/y2024-dbabdc3d.svg)
![[PITable:GhgS3]](/images/tables/pitable_ghg_s3/y2024-eb94a9cb.svg)
![[PITable:GhgInt]](/images/tables/pitable_ghg_int/y2024-65b82660.svg)
 Performance: Air Pollution
![[PITable:AirAbs]](/images/tables/pitable_air_abs/y2024-e0a2dbee.svg)
 Performance: Water
![[PITable:WatInpAbs]](/images/tables/pitable_wat_inp_abs/y2024-131726a8.svg)
![[PITable:WatInpInt]](/images/tables/pitable_wat_inp_int/y2024-752fabf5.svg)
![[PITable:WatQual]](/images/tables/pitable_wat_qual/y2024-96ca613b.svg)
![[PITable:WatOutAbs]](/images/tables/pitable_wat_out_abs/y2024-12a6ef43.svg)
![[PITable:WatOutInt]](/images/tables/pitable_wat_out_int/y2024-21a6f14f.svg)
 Performance: Waste
![[PITable:WasInp]](/images/tables/pitable_was_inp/y2024-e8100f11.svg)
![[PITable:WasOut]](/images/tables/pitable_was_out/y2024-0e2044e9.svg)
![[PITable:WasInt]](/images/tables/pitable_was_int/y2024-48b27ace.svg)
 Performance: Biodiversity & Habitat
![[PITable:Wild]](/images/tables/pitable_wild/y2024-47996d5f.svg)
![[PITable:HabAbs]](/images/tables/pitable_hab_abs/y2024-28a13c24.svg)
![[PITable:HabInt]](/images/tables/pitable_hab_int/y2024-6c1b21fc.svg)
 Performance: Health & Safety
![[PITable:EmpAbs]](/images/tables/pitable_emp_abs/y2024-5d1a7388.svg)
![[PITable:EmpInt]](/images/tables/pitable_emp_int/y2024-ce76f353.svg)
![[PITable:ContAbs]](/images/tables/pitable_cont_abs/y2024-5d1a7388.svg)
![[PITable:ContInt]](/images/tables/pitable_cont_int/y2024-ce76f353.svg)
![[PITable:CustAbs]](/images/tables/pitable_cust_abs/y2024-3eebcc82.svg)
![[PITable:ComAbs]](/images/tables/pitable_com_abs/y2024-a09cd89f.svg)
 Performance: Employees
 Performance: Customers
 Performance: Certifications & Awards
![[CaCertificationTable]](/images/tables/ca_certification_table/y2021-d0c3cb46.svg)
![[AwardTable]](/images/tables/award_table/y2021-d31fa1be.svg)